The Market as a Hunt
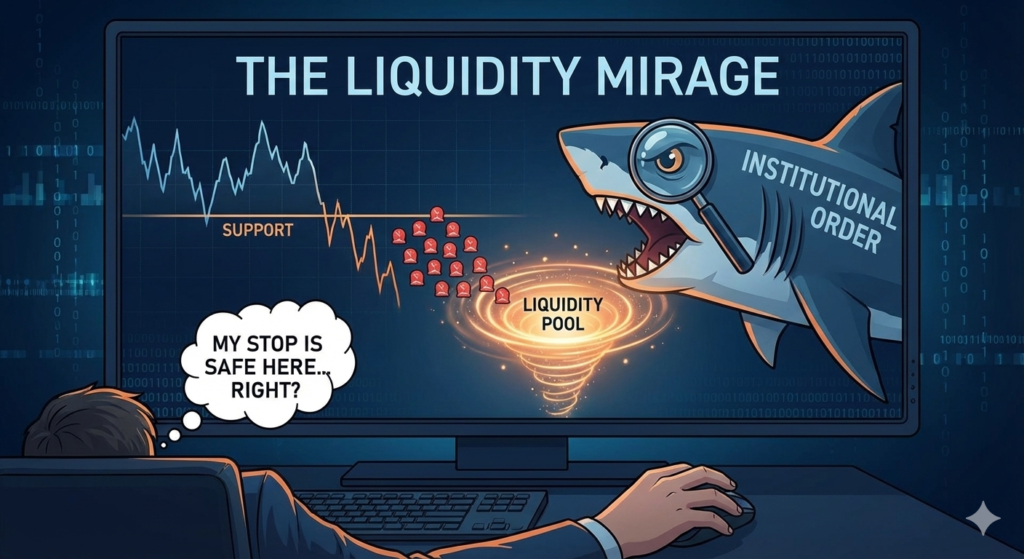
For the average trader, a support or resistance line is a protective barrier—a place where they believe the price will hold, and where they safely place their stop-loss.
For the professional, institutional, and algorithmic trader, these lines are not barriers; they are a hunting ground. These common technical levels represent a Liquidity Mirage—the illusion of safety that masks the largest cluster of resting orders (stops and limits) available in the market.
This phenomenon is the direct application of Level 2 thinking from Game Theory. It is not enough to know where the price should go; you must understand why the price often moves briefly to a completely illogical point, only to immediately reverse. This temporary, calculated move is the Liquidity Grab, and it is the primary method large players use to execute large orders without driving the price too far against themselves.
Phase I: The Anatomy of Liquidity Clustering 🏊
Liquidity is the fuel that moves the market. To execute a large order (e.g., buying $50 million of a stock), an institution needs a corresponding volume of sellers willing to take the other side.
1. What is “Clustered Liquidity”?
Liquidity clusters are prices where a large number of orders from Level 1 traders are concentrated. These clusters are created by three common, predictable errors:
- The Obvious Stop-Loss: The most predictable error. Traders place their stop-loss orders just below a swing low (Support) or just above a swing high (Resistance).
- The Obvious Breakout Entry: Traders place Limit Orders (or Stop-Entry Orders) exactly at a famous resistance line, waiting for the price to break and run.
- The Margin/Liquidation Level: Prices where highly leveraged retail accounts will automatically get margin-called and liquidated, triggering a cascade of forced selling.
2. Why Stops are Attractive Fuel
A stop-loss order is a contingent market order. When triggered, it demands immediate execution at the best available price.
- When a buy stop (placed above resistance) is hit, it becomes a market buy order.
- When a sell stop (placed below support) is hit, it becomes a market sell order.
This means that pushing the price past a cluster of sell stops instantly generates a massive, temporary pool of sellers for an institution to buy from—the perfect “fuel” for their own large-scale entry.
Phase II: The Price Action of a Liquidity Grab 📉📈
The Liquidity Grab, or “Stop Run,” has a recognizable signature that differentiates it from a genuine market reversal.
1. The Setup: High Confidence, Low Volatility
The market often approaches a major support or resistance level (the Liquidity Zone) slowly, often consolidating in a tight range. This builds confidence in the Level 1 traders who believe the line will hold. Stops are stacked in tight proximity to the line.
2. The Execution: The Spike and Sweep
A large entity or algorithm will suddenly inject enough selling pressure (a calculated, deliberate move) to push the price past the obvious stop cluster.
- The Result: The price spikes violently just beyond the support line. This is the Liquidity Sweep—all the clustered stops are triggered, providing the institution with the required volume to fill their massive order at a favorable price.
3. The Aftermath: The Immediate Reversal (The Mirage)
Once the clustered liquidity is “swept” and the large order is filled, the calculated selling pressure instantly disappears. With no genuine follow-through selling, the price immediately snaps back above the support line, often accelerating rapidly in the opposite direction.
- The Outcome: The Level 1 traders are stopped out at a loss, and the market moves in the direction they had originally anticipated, but without them. The Liquidity Mirage disappears, revealing the true intention of the move.
Phase III: Reading the Chart with Level 2 Eyes 👀
To apply Game Theory to this process, you must stop viewing the chart as random history and start viewing it as a roadmap of clustered human psychology.
1. Identify the Obvious Stops (The Hunt Map)
When analyzing any chart, assume the majority of retail traders are looking at the same obvious levels. You need to mark these clusters not as protective barriers, but as high-probability targets:
- The Double Bottom/Top: When the price hits a level twice and bounces, it creates a “floor” or “ceiling.” Retail traders put their stops just on the other side of that line.
- The Round Number (Psychological Levels): Humans have a natural bias toward “clean” numbers.
- In Stocks: These are prices like $100.00 or $50.00.
- In Forex (FX): These are prices ending in multiple zeros, like 1.1000.
- The Previous Day’s High/Low: These are the most recent “boundaries” of the market. Since every trader sees them, the stops are predictably stacked just beyond them.
2. Analyzing the Candlewick (The Evidence of the Sweep)
The most potent evidence of a liquidity grab is the long wick or “tail” of the candlestick that crossed the support/resistance line.
- A long wick that crosses a major liquidity zone and immediately closes back inside the range is the visual evidence that the market went on a temporary fishing expedition and found nothing but stops.
- If the price crosses the zone and closes as a full body candle (with a small wick), this is stronger evidence of a genuine breakout, as it indicates continuous follow-through momentum.
3. The Time-Frame Confirmation Filter
A Liquidity Grab executed on a 5-minute chart often looks like a genuine breakout on a 1-minute chart. To protect yourself, always look for confirmation on a higher time frame (e.g., the 15-minute or 1-hour chart).
- Rule: If the price executes a Liquidity Sweep on the 5-minute chart, but the 15-minute candle closes decisively above or below the original zone, it is usually a genuine move. If the 15-minute candle closes back inside the zone, there is a high probability the sweep is confirmed.
Phase IV: The Prop Trader’s Defense and Counter-Strategy 🛡️
The goal is not just to avoid being swept; it is to use the Liquidity Grab as a low-risk, high-R-multiple entry signal.
1. Stop Displacement: Move Your Stops to Less Obvious Zones
Never place your stop-loss precisely where every textbook tells you to. Instead, use filters like the Average True Range (ATR) to place your stop a calculated distance beyond the obvious cluster.
- Example: If support is at $100.00, and the daily ATR is $1.00, place your stop not at $99.90, but perhaps at $98.50, forcing the hunting algorithm to execute a much deeper, more costly sweep to reach your order.
2. The Patient Counter-Entry
The best way to trade the Liquidity Grab is to wait for it to complete and then trade the subsequent reversal.
- Protocol:
- Identify the major Liquidity Zone (S/R line).
- Wait for the price to perform the Liquidity Sweep (the spike through the zone).
- Wait for the candle to close back inside the original zone, confirming the sweep failed to attract real momentum.
- Enter the trade in the intended direction (e.g., buy after a sell-side sweep) with a stop placed just beyond the tip of the sweep’s wick. This provides a high-R-Multiple entry because your stop is very tight relative to the anticipated move back to the initial high/low.
The Prop Trader’s Lesson: The Liquidity Mirage is a cruel but reliable feature of modern markets. By adopting Level 2 thinking—understanding that the chart is a record of competition and liquidity seeking—you stop being the fuel for institutional trades and start profiting from the crowd’s predictable cluster points.
The Clarity of the Level 2 Game ✨
The Liquidity Mirage is a cruel but reliable feature of modern markets. It serves as a continuous test of market depth and the average trader’s discipline. By applying Level 2 thinking—understanding that the chart is a record of competition and liquidity seeking—you stop being the fuel for institutional trades and start profiting from the crowd’s predictable cluster points. The highest probability entries often come not at the beginning of a move, but immediately after the market has finished its calculated effort to liquidate the average trader. Master the sweep, and you master the metagame.
Disclaimer: This content is provided for educational and informational purposes only. It does not constitute, and should not be relied upon as, personalized investment advice, a recommendation to buy or sell any security, or an offer to participate in any trading activity. Trading involves substantial risk, and past performance is not indicative of future results.