
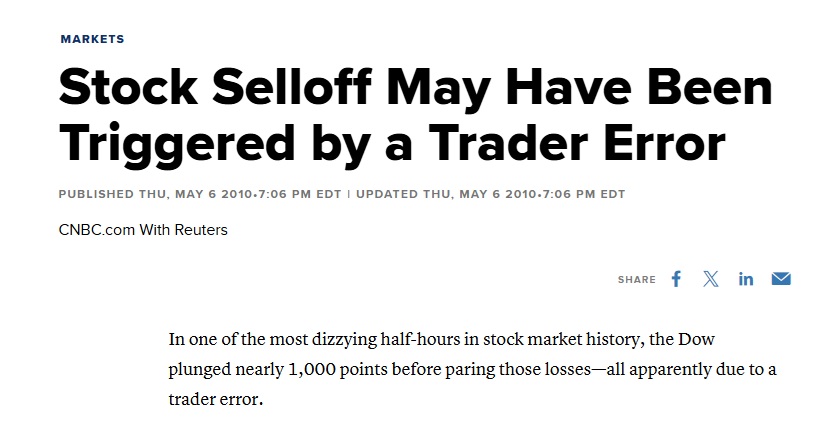
On May 6, 2010, at approximately 2:32 PM Eastern Time, the US stock market lost nearly 9% of its value in less than five minutes.
The Dow Jones Industrial Average dropped 998.50 points — at the time, the largest single-day point decline in its history. Shares of major, solvent companies traded at pennies. Accenture, a global consulting firm with billions in revenue, saw its stock price fall from roughly $40 to one cent. Shares of Sotheby’s, the auction house, traded at $100,000 in a single print. Apple briefly traded at under $230 after opening above $250.
Then, just as suddenly as it began, the market snapped back. Within twenty minutes, most prices had recovered to near their pre-crash levels. Nearly a trillion dollars in market value had evaporated and returned in less than half an hour.
The official investigation by the SEC and CFTC took months. The final report pointed to a confluence of factors: a large sell order in the E-mini S&P 500 futures contract executed by a mutual fund using an aggressive algorithm, a subsequent liquidity vacuum as high-frequency traders withdrew from the market, and a fragmented regulatory structure that had no mechanism to halt the cascade across different exchanges.
Five years later, the Department of Justice and the CFTC filed criminal and civil charges against a single trader in London — Navinder Singh Sarao — alleging that his “spoofing” activity had contributed to the crash. Sarao, operating from his parents’ house in Hounslow, had used a customized trading program to place large sell orders he never intended to execute, creating the illusion of selling pressure, then canceling the orders and buying into the resulting price decline.
The Flash Crash was not an isolated event. It was a preview.
🎯 What Actually Happened: A Step-by-Step Breakdown
The SEC-CFTC report identified a sequence of events that, in hindsight, reads like a blueprint for modern market fragility.
Step 1: The Large Sell Order
At 2:32 PM, a mutual fund initiated a sell program for 75,000 E-mini S&P 500 futures contracts, worth approximately $4.1 billion. The algorithm used to execute this trade was designed to target a volume participation rate — it would sell at a rate equal to 9% of the total market volume, regardless of price.
Under normal conditions, this algorithm would have distributed the sell order over several hours, and the market would have absorbed it. On May 6, conditions were not normal.
Step 2: High-Frequency Traders Absorb, Then Flee
Initially, high-frequency trading firms bought the contracts being sold by the mutual fund’s algorithm. This is the normal function of HFT in the market — providing liquidity by taking the other side of large orders.
But these firms do not hold positions. They buy and then immediately resell to someone else. On May 6, the “someone else” was another HFT firm, which did the same thing. The contracts began to “hot potato” between HFT firms, with each firm holding the position for fractions of a second before passing it on.
When the selling pressure continued and prices began to fall, the HFT firms did what their algorithms are programmed to do when risk exceeds thresholds: they stopped buying. Some withdrew entirely from the market. Liquidity evaporated.
Step 3: The Liquidity Vacuum
With HFT firms gone, the only remaining buyers were fundamental traders — humans and long-term algorithms that evaluate price relative to value. But prices were moving so fast that these systems could not keep up. Stale quotes, system delays, and the sheer speed of the decline meant that buy orders that would normally have provided a floor simply did not execute.
At 2:45 PM, the E-mini S&P futures had fallen over 5% in thirteen minutes. The decline then accelerated into the equities markets.
Step 4: The Broken Trades
As individual stocks crashed, a surreal sequence of prints appeared on the tape:
- Accenture: traded at $0.01 (down from roughly $40)
- Sotheby’s: traded at $99,999.99 (up from roughly $34)
- Apple: briefly traded below $230
- 3M: fell from $85 to $68 in minutes
- Procter & Gamble: dropped nearly 37%
Over 20,000 trades across more than 300 securities were later canceled by the exchanges, deemed “clearly erroneous” — a euphemism for “the price at which these trades executed had no relationship to any rational assessment of value.”
Step 5: The Snapback
At approximately 2:46 PM, buying returned. Prices rebounded almost as quickly as they had fallen. By 3:00 PM, the Dow had recovered roughly 700 of the 998 points it had lost. The market closed down 3.2% on the day — a bad day, but not a catastrophic one. The catastrophe had been compressed into minutes.
👤 The Hound of Hounslow: Sarao and Spoofing
Five years after the crash, investigators uncovered something the original SEC-CFTC report had missed.
Navinder Singh Sarao was a self-taught trader operating from his parents’ home in Hounslow, West London. Using off-the-shelf trading software that he had modified himself, Sarao employed a technique called spoofing — placing large orders with no intention of executing them, creating a false impression of supply or demand, and then trading on the resulting price movement.
His method, called dynamic layering, worked like this:
- Sarao’s program would place multiple large sell orders at prices slightly above the current market — close enough to be visible to other traders, but not close enough to be immediately executed.
- Other algorithms, seeing these sell orders, would interpret them as genuine selling pressure. HFT algorithms, in particular, are designed to detect order book imbalances and trade ahead of them.
- As other traders sold in response to the perceived pressure, prices fell.
- Sarao’s program would then cancel the fake sell orders and buy into the declining market at lower prices.
- When prices recovered — as they typically did once the fake orders were removed — Sarao sold at a profit.
The CFTC complaint alleged that Sarao used this technique on May 6, 2010, and that his spoof orders contributed to the liquidity imbalance that triggered the crash. On that day alone, Sarao allegedly made approximately $879,000 in profits.
Sarao was eventually extradited to the United States, pleaded guilty to one count of electronic fraud and one count of spoofing, and was sentenced to one year of home detention. He was also ordered to forfeit $12.8 million.
The remarkable thing about Sarao’s operation was not its sophistication. It was its simplicity. A single trader, with modified software and a home internet connection, had contributed to a trillion-dollar market event.
📉 The Other Flash Crashes
The 2010 Flash Crash was the most famous, but it was not the last. The years since have produced a steady drumbeat of similar events, each revealing a different vulnerability in the algorithmic market structure.
The Treasury Flash Crash — October 15, 2014
The US Treasury market — the deepest, most liquid bond market in the world — experienced a violent intraday swing. The 10-year Treasury yield plunged 33 basis points and then snapped back, all within roughly twelve minutes. No obvious news catalyst. No economic data release. Just a sudden, unexplained liquidity vacuum in the world’s most important bond market.
The official report cited a combination of high-frequency trading, declining dealer inventories, and the fragmentation of the Treasury market across electronic platforms. The takeaway: if it can happen to Treasuries, it can happen to anything.
The Pound Flash Crash — October 7, 2016
In the early hours of the Asian trading session, the British pound collapsed from roughly $1.26 to $1.14 in approximately two minutes — a move of over 6%, almost unprecedented for a major currency. It then recovered most of the losses within minutes.
The Bank for International Settlements later concluded that the crash was likely triggered by a combination of thin liquidity during the Asian session, algorithmic trading amplifying the initial move, and stop-loss orders cascading as the price fell. No single cause. No single villain. Just the architecture of the modern currency market, exposed.
The VIX Explosion — February 5, 2018
The VIX, a measure of implied volatility on the S&P 500 often called the “fear index,” more than doubled in a single day — from roughly 17 to over 37. This was the largest single-day percentage increase in the VIX’s history.
The cause was not a geopolitical event or an economic shock. It was the unwinding of short-volatility products — exchange-traded notes that allowed investors to bet against volatility. When volatility rose modestly, these products were forced to buy VIX futures to cover their positions, which pushed volatility higher, which forced more buying, in a feedback loop that produced the single wildest day in volatility market history. Several short-volatility products were completely wiped out.
The March 2020 Circuit Breakers
During the COVID-19 selloff in March 2020, US equity markets hit circuit breakers — automatic trading halts designed to prevent cascading crashes — on four separate days. The circuit breakers worked as designed: trading paused, the market had time to absorb information, and when trading resumed, the panic had subsided.
But the fact that they were triggered at all — four times in a single month, after years of relative calm — revealed how quickly algorithmic selling can overwhelm the market’s ability to absorb it.
🧠 What Flash Crashes Reveal About Modern Market Structure
Each of these events is different in its details. But they share a common architecture. That architecture is the real story.
1. Liquidity Is an Illusion
In normal conditions, markets appear deep. The order book shows thousands of contracts available at every price level. Spreads are tight. Trades execute instantly.
But that liquidity is provided disproportionately by algorithms that have no obligation to stay. When volatility spikes or risk thresholds are breached, those algorithms withdraw. In an instant, a market that appeared to have endless depth becomes a vacuum.
This is the central paradox of electronic liquidity: the more the market relies on algorithmic market-making, the more liquidity there is in normal times — and the less there is when it is actually needed.
2. Speed Creates Fragility
The faster the market moves, the less time there is for human judgment to intervene. When prices are falling at rates measured in milliseconds, no human can assess whether the move is justified by fundamentals. The machines trade with machines, and the feedback loops compound.
Circuit breakers — automatic trading halts when prices move too far, too fast — are the only mechanism that inserts a pause into this process. They are an admission that the market cannot regulate itself at speed.
3. Fragmentation Magnifies Chaos
US equities trade across more than a dozen exchanges and dozens of dark pools. When a liquidity crisis hits, there is no single order book to absorb it. Liquidity is scattered across venues, and algorithms that normally knit those venues together can stop doing so when volatility spikes.
The result is that prices on one exchange can diverge wildly from prices on another — as they did during the 2010 Flash Crash, when some stocks traded at pennies on one venue while trading at normal prices on another.
4. The Individual Can Still Move the Market
The Sarao case demonstrated that a single trader, with relatively simple tools, could contribute to a systemic event. The market’s complexity is not a defense against manipulation. In some ways, it is an amplifier. Algorithms that respond to order book signals can be tricked by fake signals, and the speed of their response means the manipulation can propagate before anyone detects it.
5. The “Fat Finger” Is Rarely the Real Cause
After every flash crash, there is speculation that someone made a “fat finger” error — entering an order that was too large or at the wrong price. In almost every case, the investigation finds no such error. The cause is not human clumsiness. It is structural fragility. The system is capable of producing crashes without anyone making a mistake. All it needs is the right combination of selling pressure, algorithmic response, and liquidity withdrawal.
🛡️ What This Means for the Retail Trader
You cannot predict the next flash crash. You cannot trade around it. You cannot outrun the algorithms that will drive it. What you can do is understand that the market is not a stable system and trade accordingly.
1. Use Hard Stop-Losses, Not Mental Ones
During a flash crash, the speed of the decline means you cannot react manually. A hard stop-loss — an electronic order resting on the exchange — will execute even if you are not watching. It may execute at a worse price than you intended, but it will execute. A mental stop-loss will not.
2. Understand That Stop-Losses Can Slip
During the 2010 Flash Crash, stop-loss orders were triggered at prices far below where they were set. Slippage — the difference between your stop price and your fill price — becomes extreme during liquidity vacuums. This is not a broker problem. It is a market structure problem. When there are no buyers, there are no buyers, and your fill price reflects that reality.
3. Avoid Holding Through Major News Events
Flash crashes are more likely during periods of heightened uncertainty. If you are holding positions through FOMC announcements, election results, or geopolitical shocks, you are exposed to a liquidity event that could trigger cascading stops and algorithmic withdrawal. Close positions before events or accept that your risk is larger than your stop-loss suggests.
4. Circuit Breakers Are Your Friend
The introduction of market-wide circuit breakers after the 2010 Flash Crash is one of the few regulatory responses that actually works. If the S&P 500 falls 7% in a single day, trading halts for 15 minutes. If it falls 13%, it halts again. If it falls 20%, the market closes for the day.
These pauses are not a sign that the system is broken. They are a sign that the system knows it is fragile and has built in the only mechanism that can stop a cascading crash: time.
5. Never Use Excessive Leverage
The single best defense against a flash crash is to be positioned such that even the worst intraday move does not blow your account. If you are leveraged to the point where a 5% intraday move wipes you out, you are not trading an edge. You are betting that the market will never have another May 6, 2010. It will.
🏁 The Bottom Line
The Flash Crash of 2010 was not a glitch. It was a demonstration.
It demonstrated that a market dominated by algorithms can come apart in minutes. It demonstrated that liquidity provided by machines disappears when it is most needed. It demonstrated that prices can detach from value so completely that a $40 stock trades at a penny. It demonstrated that a single trader in a London bedroom can contribute to a trillion-dollar event.
The market has since implemented safeguards. Circuit breakers. Kill switches. Better coordination between exchanges. But the fundamental architecture has not changed. The same algorithms that provide liquidity in calm markets will withdraw it in panicked ones. The same feedback loops that amplify small moves into large ones are still in place. The same fragmentation across venues still exists.
The next flash crash will not look exactly like the last one. But it will be driven by the same forces: algorithmic trading, liquidity illusions, and the speed gap between machines and humans.
The market is not a stable system that occasionally breaks. It is a fragile system that mostly holds. Trade like you understand the difference.
Disclaimer: This information is for educational and informational purposes only and does not constitute financial, investment, or legal advice. Trading in financial markets involves significant risk of loss and is not suitable for all investors. Any decisions made based on this content are the sole responsibility of the reader.